Growth and Reports
The Growth group in the Visibility workspace rail turns a client site's data into something to act on and something to share. It has three views: Opportunities (specific fixes mined from Search Console), Strategy (a written search-growth gameplan), and Reports (the monthly visibility report for the client).
What It's For
Use Opportunities to pick this week's SEO work, Strategy to set the longer plan, and Reports to show the client how their visibility moved. Opportunities and Strategy are advice: nothing here creates tasks, drafts or posts on its own. Pick the client site in the rail first.
Opportunities
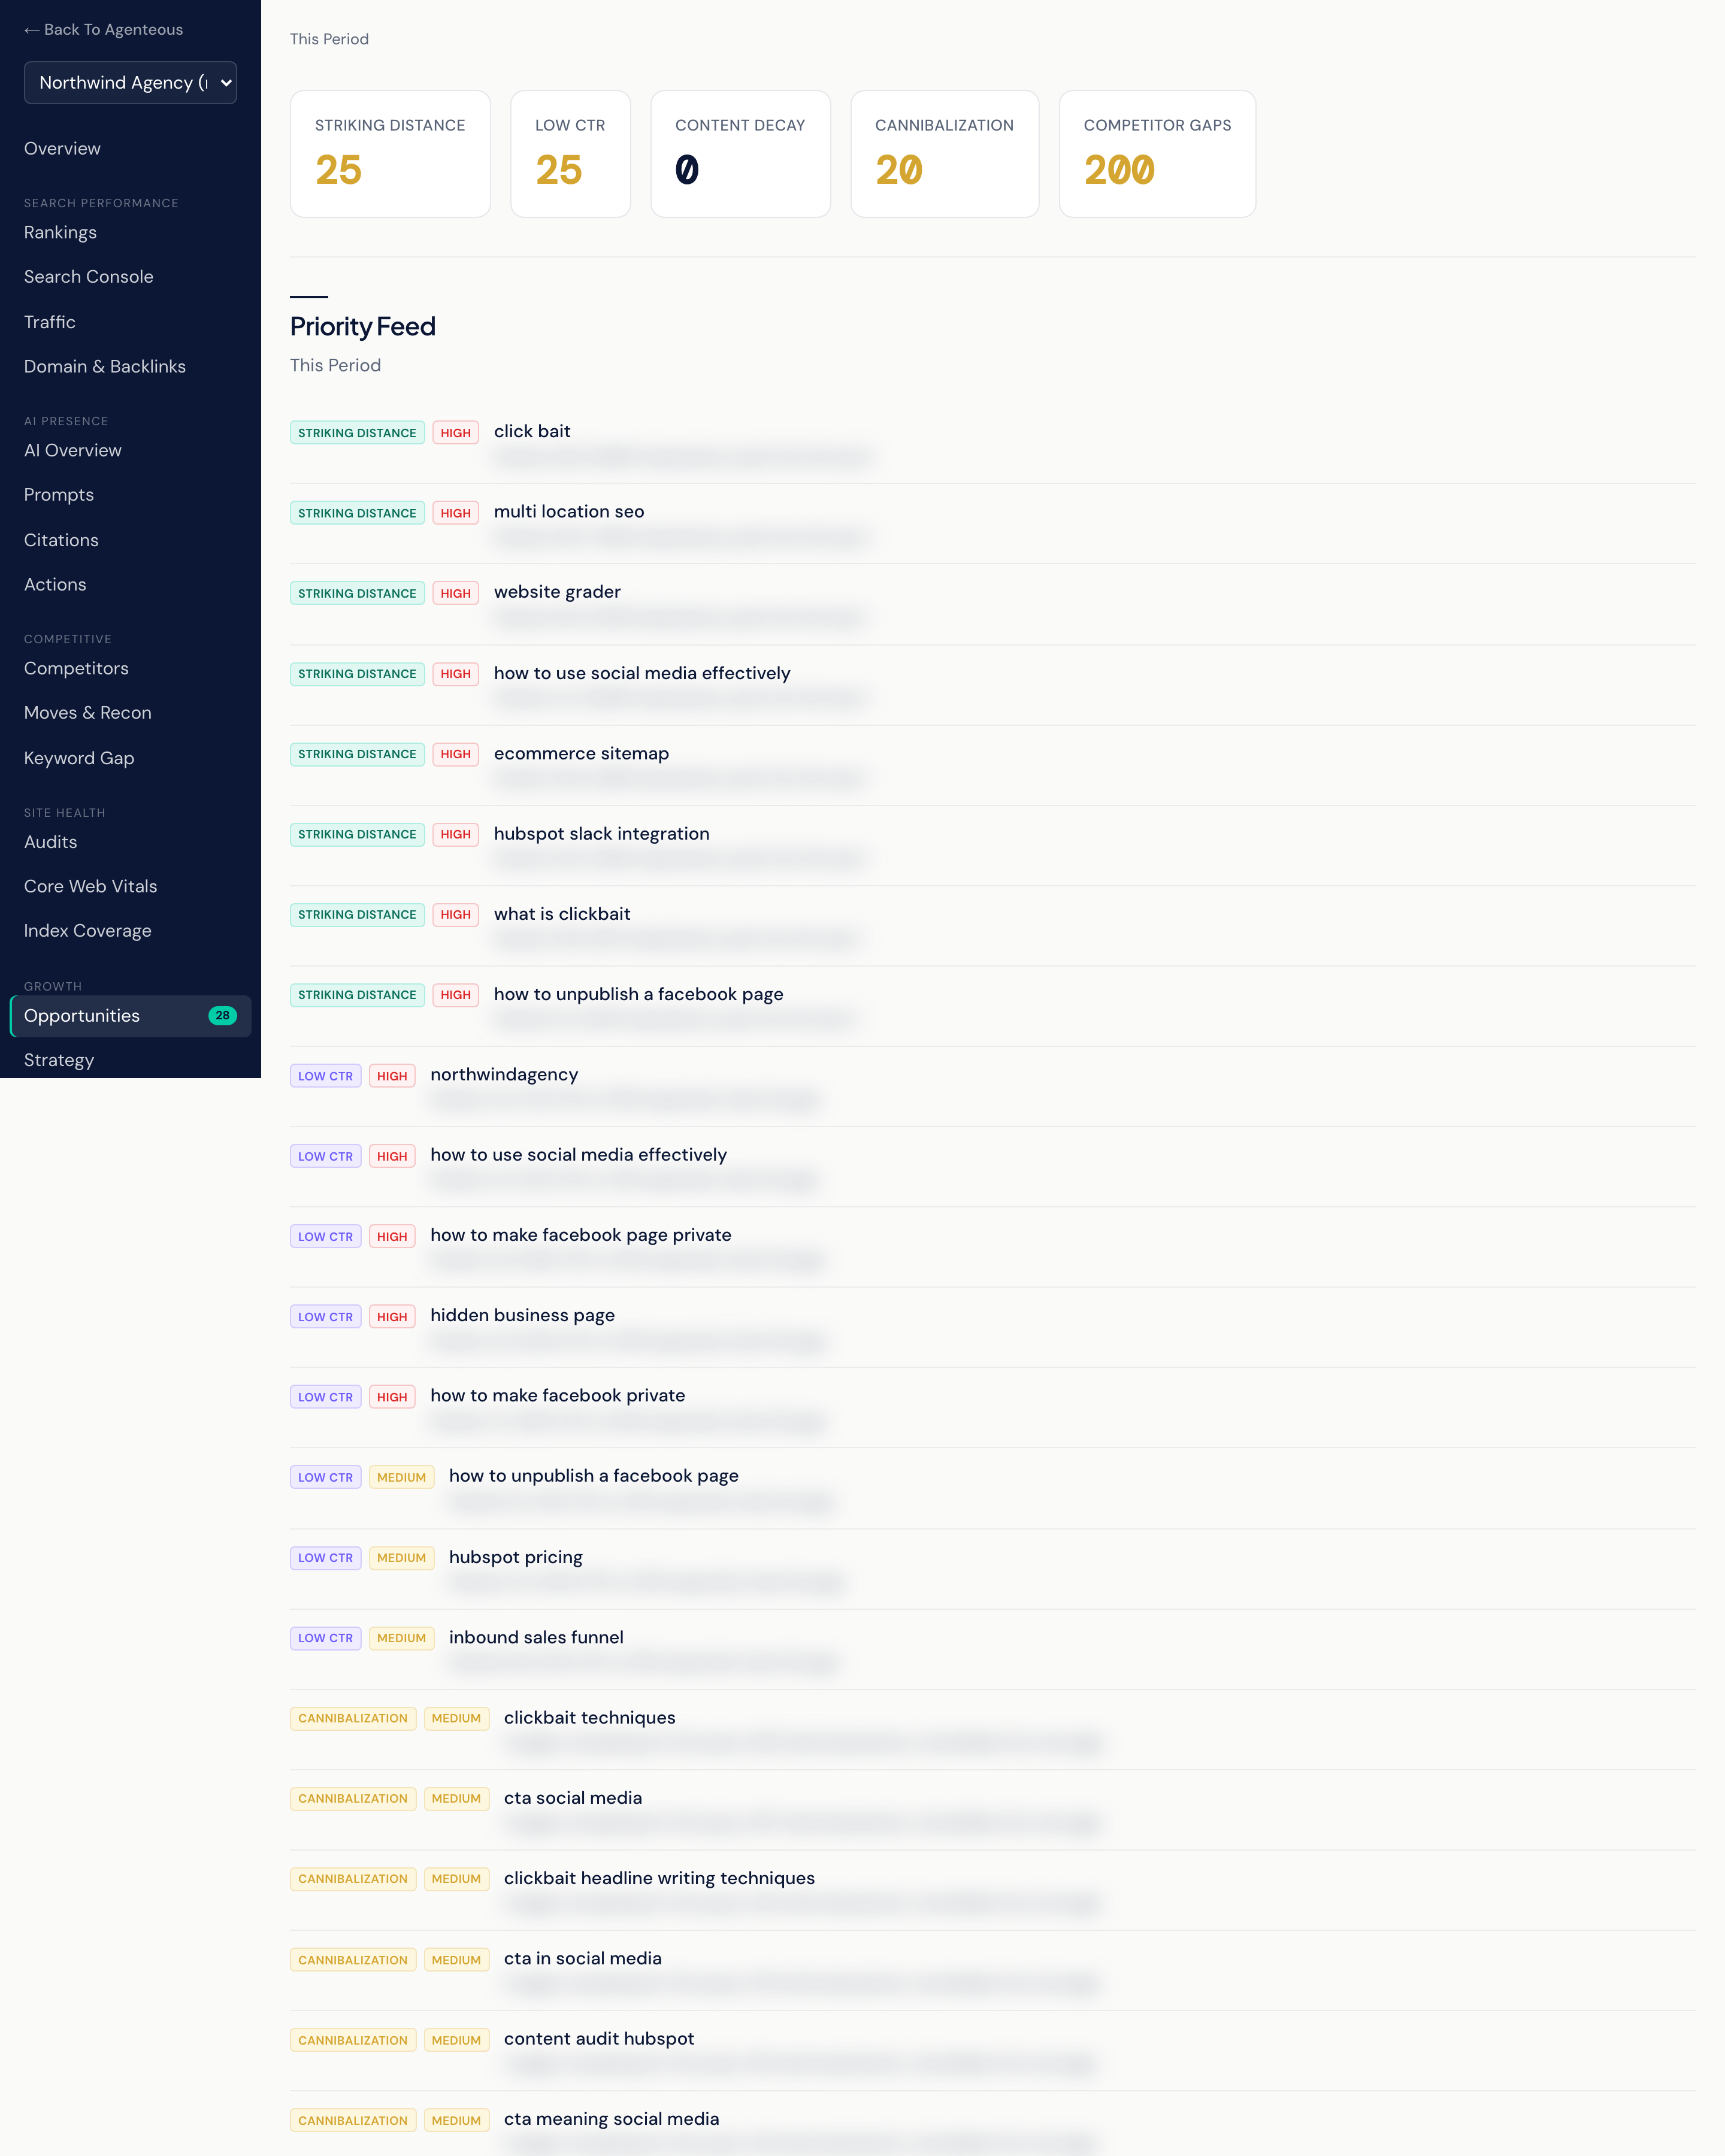
Opportunities are found by fixed rules over the last 28 days of the site's Search Console data, recalculated on every monitor sweep. Because the window is fixed, this view has no date-range control; its caption reads This Period. When there are open opportunities, the Opportunities entry in the rail shows how many.
Counts across the top: Striking Distance, Low CTR, Content Decay, Cannibalization and Competitor Gaps.
Priority Feed lists the strongest items from every type in one place. Each shows its type, a severity tag, the query or page, and a one-line reason, such as "Position 7.2, 1,450 impressions; push into the top 3". Items with the most at stake (more impressions, a wider CTR shortfall, or a steeper drop in clicks) are tagged high.
The tables below explain each type:
- Striking-Distance Keywords: queries ranking in positions 4 to 20 with at least 20 impressions. They are close enough to reach the top 3 with targeted work. Potential estimates the clicks the query would earn about three places higher.
- Low CTR Pages: queries in the top 15 with at least 50 impressions whose click-through rate is more than two points below what that position normally earns. Expected CTR and CTR Gap show the shortfall. A better title and description usually closes it.
- Content Decay: pages that had at least 10 clicks in the previous period and have since lost a quarter or more of them. Previous Clicks, Current Clicks and Change show the drop. Look for stale content, a technical change, or lost links.
- Cannibalization: queries where two or more of the site's own pages compete, splitting clicks and authority. Each query lists the competing pages. Consolidating them into one page is the usual fix.
Competitor gaps come from the Keyword Gap view and appear in the Priority Feed and the count. The view is read-only.
Strategy
An AI-generated search-growth gameplan, synthesized from the site's tracked keywords, rankings, site audit and competitor snapshots. It has seven sections: Executive Summary, Top Opportunities, Quick Wins, Keyword Targets, Content Recommendations, Technical Fixes and Competitor Gaps. Items can carry an impact level, and the date it was generated shows at the top.
Generate Strategy writes the first gameplan; after that the button reads Regenerate. Generation takes 10 to 30 seconds and replaces the gameplan on screen with a new one. If there is no strategy yet, add keywords and run Refresh Now on the Visibility Overview so there is data to work from. If generation fails, check that SEO tracking is on for the site and that data has been collected, then try again.
Reports
The monthly visibility report for the client site, as a PDF you can share. Each report covers one calendar month and includes a written summary, headline numbers, the AI presence trend, an engine-by-engine breakdown, competitor mentions, citation analysis, completed actions and prompt gaps.
Reports are generated automatically on the 2nd of each month at 10am for the month before, and each is also posted to the Marketing SEO agent's Slack channel. Generate Monthly Report makes one now for the previous calendar month. It takes a couple of minutes; reload the view to see it.
Each row shows the Period, when the report was generated, and the opening lines of its written summary when it has one. Download PDF saves the file. Nothing is emailed to the client: you decide when and how to share it.
The report's header color, logo and "prepared by" name come from the Report Brand Color, Report Logo URL and Report Prepared By fields set when the client site was added.
Who Uses It
- SEO specialists: work the Opportunities tables each week.
- Strategists: use the Strategy gameplan to plan the next quarter's search work.
- Account managers: download the monthly report for client reviews.