Spend and Time Saved
What It's For
This screen puts the cost of running your agents next to an estimate of the time they save your team. It has two tabs: Cost, for AI spend per day over the last 30 days, and Time Saved, for the estimated hours your automations saved. Both are read-only.
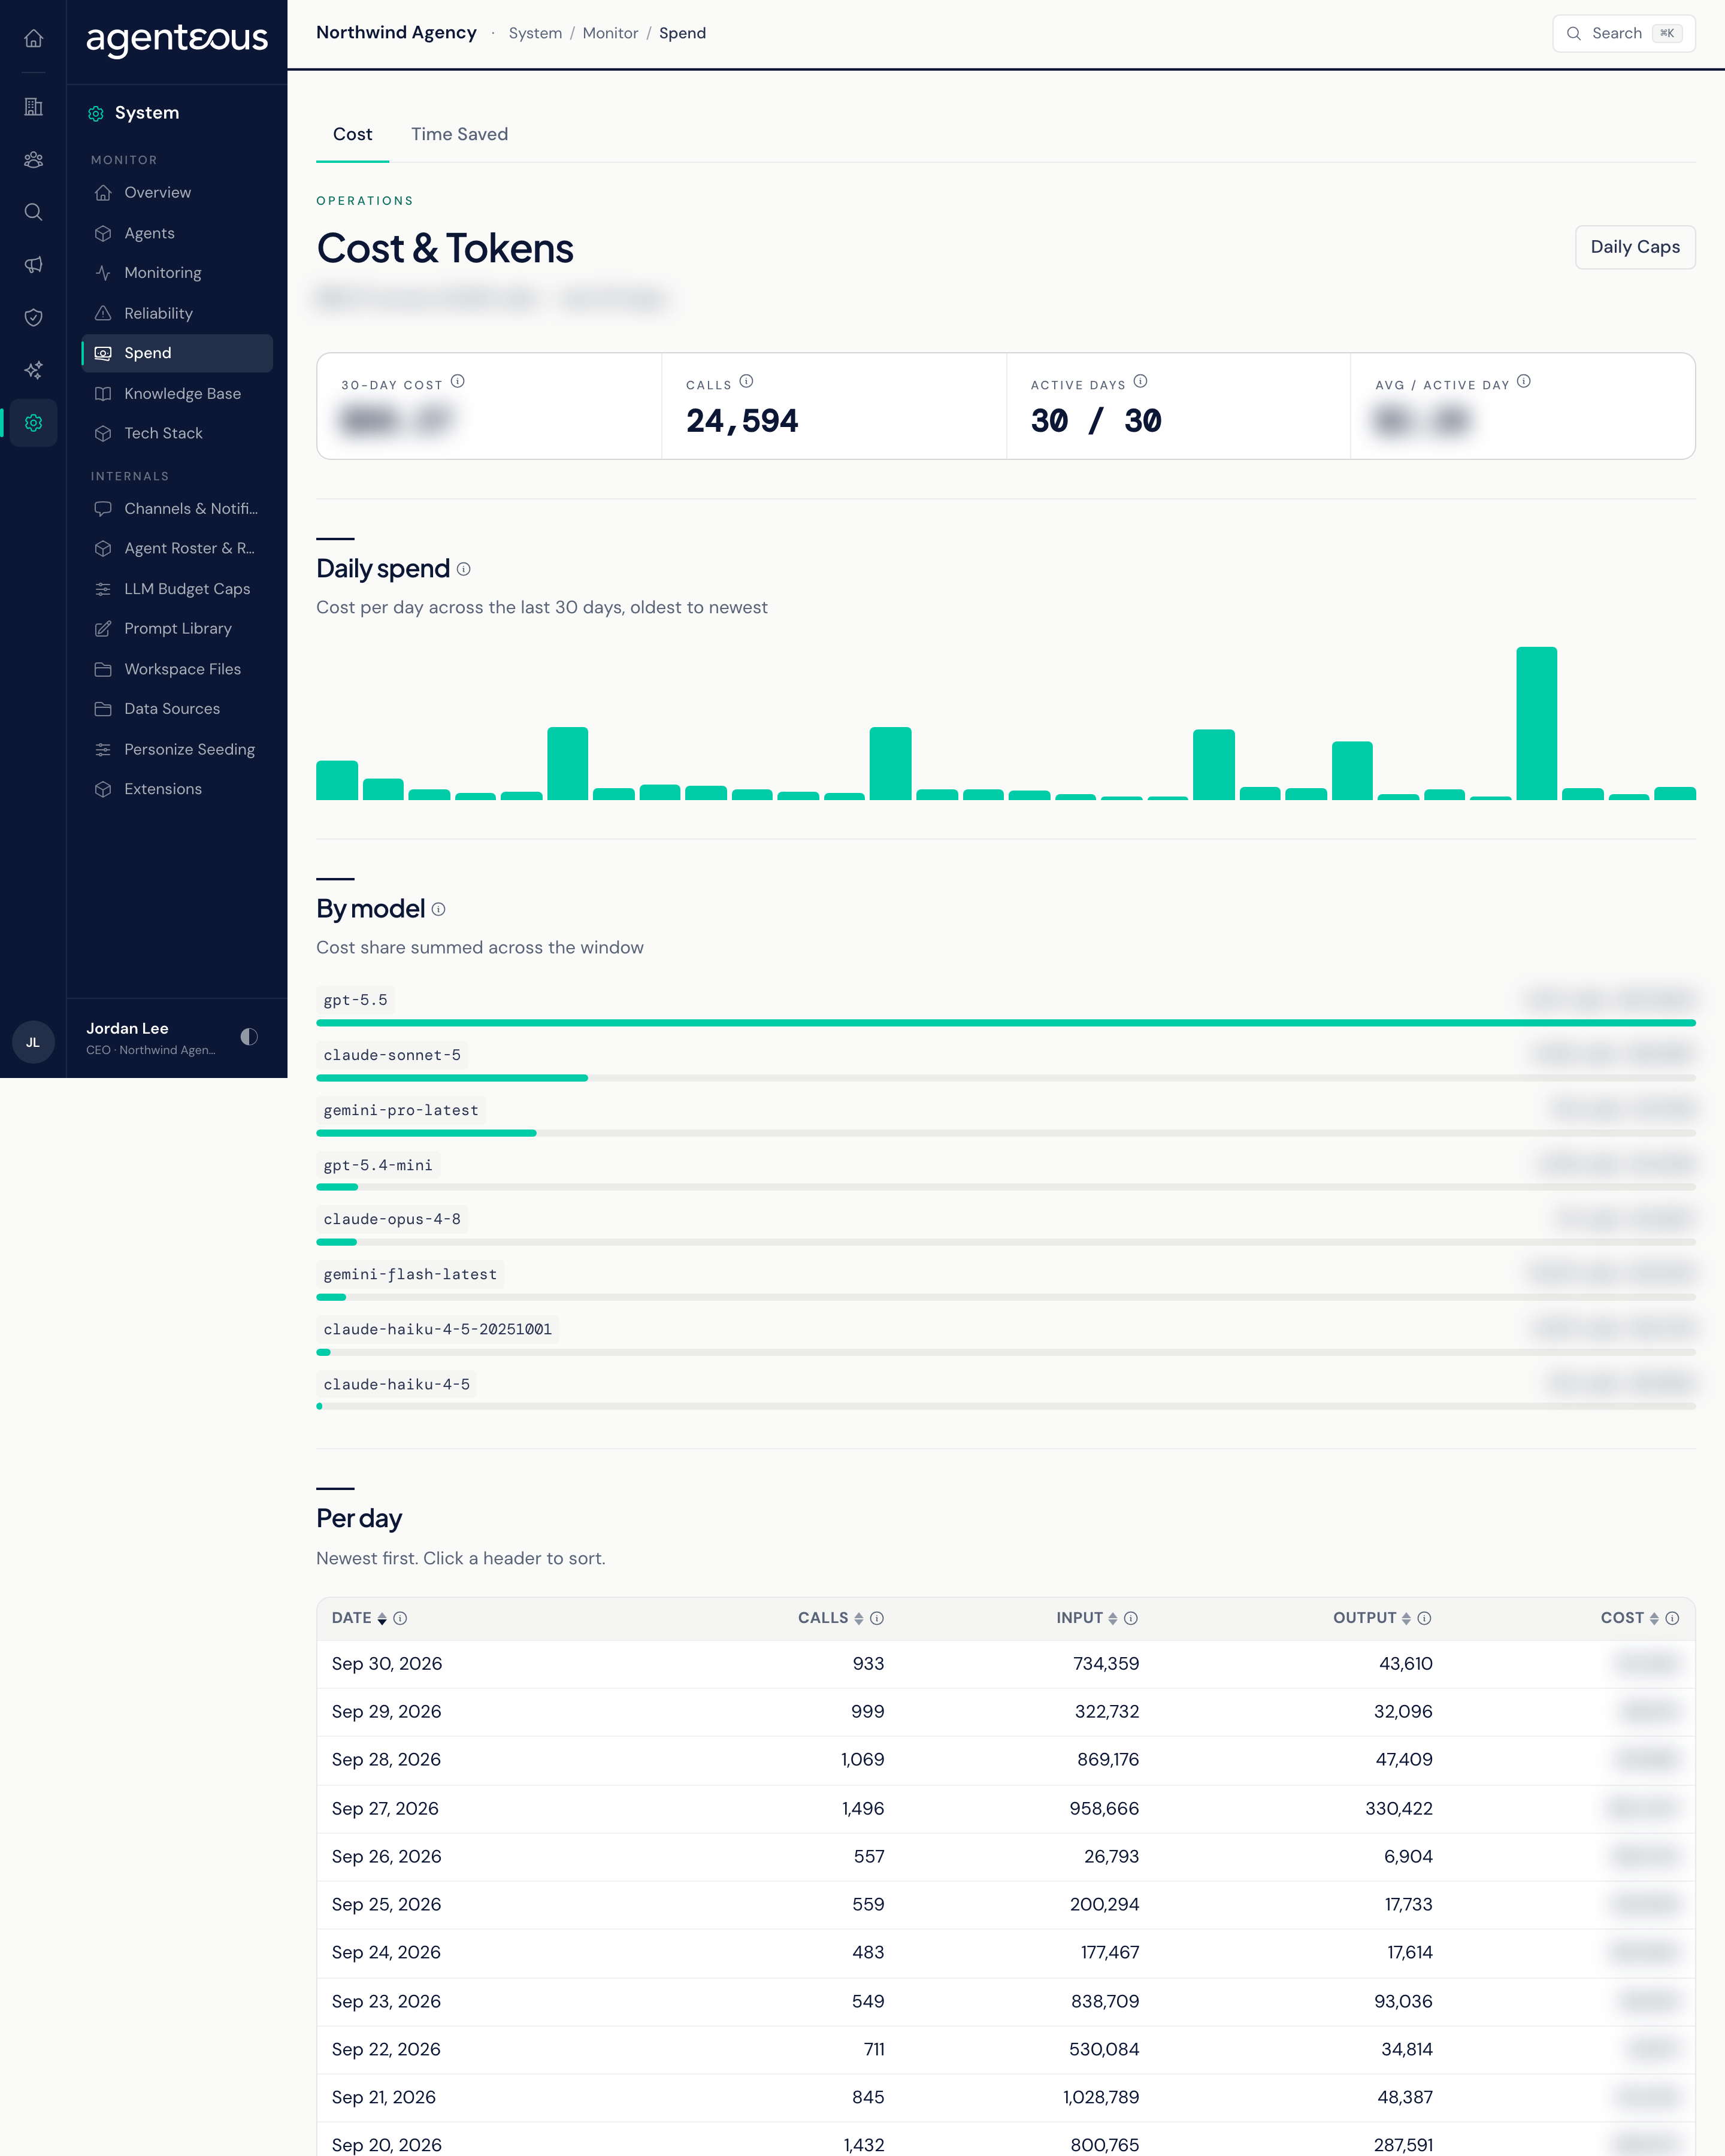
You find it in the Operator Console under System.
Cost
The screen is titled Cost & Tokens and always covers the last 30 days. The tiles show the 30-day cost, the number of Calls, Active days (days with any AI calls), and Avg / active day.
Below them:
- Daily spend: cost per day, oldest to newest. Days with no calls show as zero.
- By model: each AI model's share of the 30-day cost.
- Per day: newest first, with the date, number of calls, input and output size, and cost. Click a header to sort.
Days follow UTC, so a late-evening call can count toward the next day.
The Daily Caps link in the header opens the settings where daily AI spending limits are set. For the individual calls behind these numbers, see the Activity tab of Monitoring.
Time Saved
An estimate of operator time saved by automations over the last 30 days. It is a calculation, not a measurement: Agenteous counts how many times each tracked kind of action happened in that window and multiplies by a fixed number of minutes per action. Actions that were denied or failed save no time and are not counted.
The tiles show Hours Saved, Actions Automated, the Window, and the Top Saver (the automation type that saved the most time). Time Saved Per Day charts the daily total with the average and busiest day. Where The Time Comes From shows each type's share. By Automation Type lists each type with its count, minutes each, and total time saved.
The tracked actions and their minutes as shipped:
| Automation | Minutes each |
|---|---|
| AI Visibility Report Compiled | 30 |
| Churn Pattern Computed | 20 |
| Proposal Drafted and Approved | 20 |
| Content Plan Generated | 15 |
| MSA Proposal Executed | 15 |
| Meeting Transcript Digested | 12 |
| Testimonial Captured | 12 |
| AI Visibility Actions Generated | 10 |
| Meeting Intel Promoted to Content | 10 |
| Email Reply Drafted | 10 |
| Customer Success Action Surfaced | 8 |
| Knowledge Lookup | 5 |
| Content Triaged | 4 |
| Inbound Email Triaged | 3 |
The minutes are estimates, not timings of your team's work. They cannot be changed from the Operator Console. For the stretch of the window before some automations were recorded in the audit trail, the count includes actions rebuilt from each feature's own records, and a note on the tab says how many. Rebuilt actions are never counted twice.
Who Uses It
- Agency owners: weigh AI spend against the time it frees up.
- Operations administrators: spot a spending spike and trace it to a model or a day.