Portal Audit
Connect a HubSpot portal, scan it against a fixed set of benchmarks, and produce a branded audit report: a health score, a list of findings, the quick wins worth doing first, and a prioritized remediation roadmap. The report exports as a PDF, a slide deck, a spreadsheet, or Markdown, and the client-facing exports can be white-labeled with your agency's colors and logo.
What It's For
Run a portal audit when you need to know the state of a HubSpot portal you did not build: a new client's inherited instance, a pre-sales assessment, a quarterly health check, or the evidence behind a remediation proposal.
It is a read-only diagnostic. It asks HubSpot only to read and search data, so it cannot change anything in the portal. When you want to price the fixes it surfaces, hand the finished audit to the Audit Remediation Wizard, which turns the findings you select into a scoped estimate.
How It Works
The audit runs as a pipeline. The important thing to understand is that the scoring and the writing are separate jobs, done by different means.
Everything that produces a number is ordinary code. The tool connects to the portal, pulls the data, and runs it through more than a hundred pass/fail checks with fixed thresholds. Bounce rate under 2%. Unsubscribe rate under 1%. No more than 5% of contacts without an owner. An ideal pipeline of between four and eight stages. A check either passes or it does not, and no model is consulted.
Only after the scoring is settled does a model see anything. It receives the pass/fail results, a scoring rubric, a knowledge base of industry benchmarks, and the raw portal data, and it writes the analysis: what each failure means, what it costs the business, what to do about it, and how urgent it is. It never sees a chance to change a score.
So the health score is arithmetic you could reproduce by hand. The judgment about what the score means is the model's, and it is grounded in numbers it was not allowed to invent.
The Two Numbers, and Why They Disagree
The report shows a Health Score as a percentage, and next to it a count like "43 of 75 checks passed". Those two figures will often not agree, and that is deliberate.
The check count is a plain sum: every check in every area, added up. The health score is a weighted average of each area's pass rate, because not all areas matter equally. Portal setup, contact data, and marketing carry full weight. Deals and activity carry slightly less, service and content less again, then properties, and reporting carries the least.
An audit reading "50% Health Score" beside "43 of 75 checks passed" is not broken. 43 of 75 is 57%, but the portal failed more of its heavily weighted checks than its lightly weighted ones, so the weighted score lands lower. The percentage tells you how healthy the portal is where health counts. The tally tells you how much there is to fix.
Setup
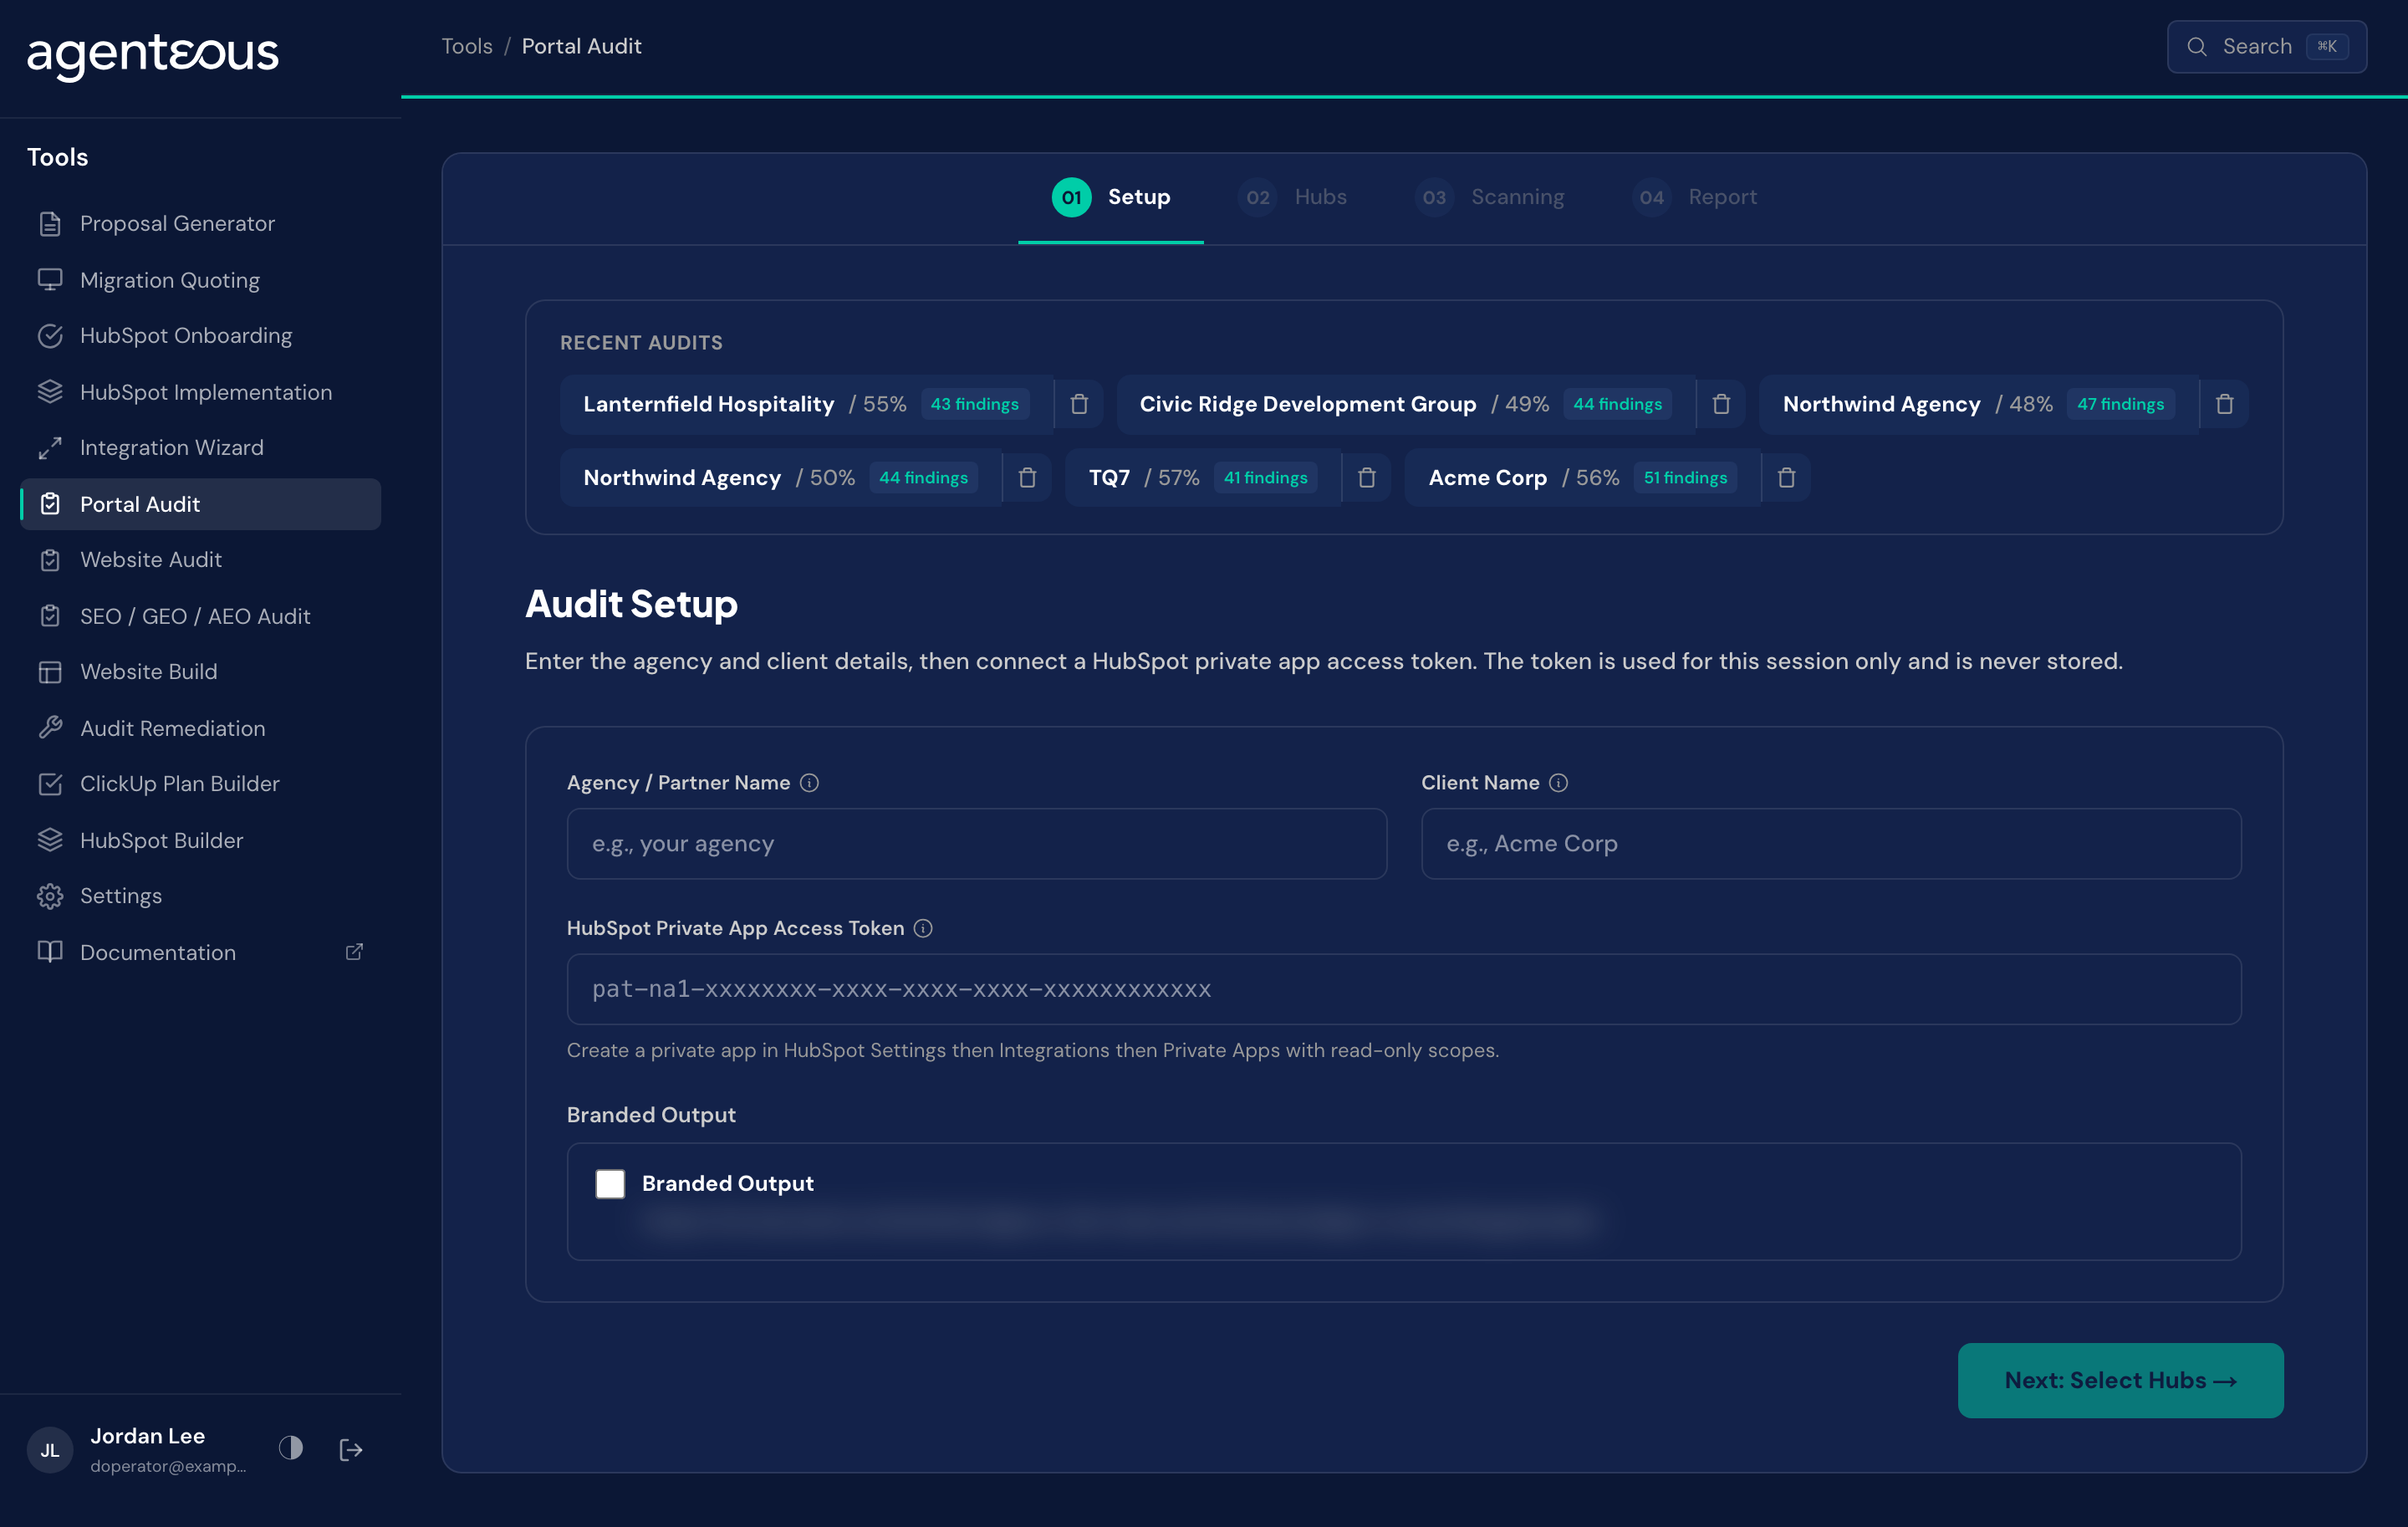
What you supply. The agency or partner name, which appears on the report header and the branded export. The client name, used in the report title, the saved-audit list, and the exported file names. And a HubSpot Private App access token from the client's portal, created under Settings, then Integrations, then Private Apps, with read-only scopes.
What happens. The token is used for this session only. It is never saved, and it is never sent anywhere except to HubSpot.
Behind the scenes. No model runs on this step. The tool probes the portal's endpoints to work out which hubs actually exist and which permissions the token grants. That probe is what pre-selects your hubs on the next screen.
Hubs
What you supply. Which hubs and areas to scan. Areas the scope probe confirmed are pre-checked; ones it could not confirm are marked. Portal foundation, property health, and reporting are always included.
What happens. Your selection sets the scope of every later step. This is the one substantive judgment you make before the audit runs, and it is worth spending a moment on: an area you exclude produces no checks, no findings, and no contribution to the score.
Behind the scenes. No model runs on this step either. You can force-select an area the probe did not confirm; it will simply return less data.
Scanning
What you supply. Nothing. This step is a progress display.
What happens. Three passes run in order. First the tool extracts the portal data, one area at a time. Then it scores that data against the benchmarks, which is instant because it is pure computation. Then the analysis begins.
Behind the scenes. This is where the models work, and there are three distinct passes.
The section analysis runs once per area, all areas at the same time. Each call receives the pass/fail checks for that area, the rubric that defines what maturity looks like there, a hand-authored knowledge base of industry benchmarks and anti-patterns, and the raw extracted data. It returns the findings for that area. For each finding it supplies the impact on the business, a concrete recommendation, an effort estimate, a severity, and whether it counts as a quick win. It also returns a 0-to-5 maturity rating and a short consultative summary.
Severity and quick-win status are assigned by the model against written criteria, not calculated. Critical means revenue, compliance, or data integrity is actively at risk. High means significant operational impact, worth addressing within a fortnight. Medium is hygiene, worth doing within the month. Low is backlog. A finding is a quick win only when the effort is under two hours and the impact is high.
That 0-to-5 maturity rating is a different number from the health score. The health score is arithmetic. The maturity rating is the model's calibrated opinion, and the rubric tells it to be honest: a 3 means the area is intentionally configured and mostly consistent, a 5 means industry-leading, and most portals land between 1 and 3.
Next, the synthesis pass reads every section's findings at once and produces what no single section could see: an executive summary, the patterns that cut across areas, an assessment of recurring themes like tribal-knowledge dependency and single points of failure, and the roadmap. Roadmap priorities run P0 Immediate, P1 This Week, P2 Next 2 Weeks, P3 Next 30 Days, P4 Backlog. The model assigns those priorities by reasoning across the whole portal; they are not mechanically derived from severity.
Finally a humanizing pass rewrites the prose so it reads like a consultant wrote it rather than a machine. It is explicitly forbidden from touching any number, score, or severity. If it fails, the report simply shows the unpolished text.
Report
What you supply. Optionally, your branding under Export Branding: a primary and secondary color, a Google font, and a logo (PNG or SVG, up to 2 MB). Branding affects only the client-facing exports. The on-screen report keeps the platform look. If you turned on Branded Output on the Setup screen, a Branded PDF button joins the export row.
What happens. The report opens on six tabs. Overview carries the health score, the per-area breakdown, and the executive summary. Findings lists everything found, filterable by severity and area. Quick Wins is the subset worth doing immediately. Checks shows every individual benchmark and whether it passed. Roadmap is the prioritized plan. Details holds the raw extracted data.
From here you can use Print / PDF (which opens a print-ready view you save as a PDF), download a PowerPoint deck, an Excel workbook or Markdown, or send the audit straight to the Remediation Wizard to price the work.
Every audit saves itself when the report is built and appears in the saved-audits list on the first screen. Saved audits are visible to every teammate who uses the tools, so one person can run an audit and another can open it or take it into remediation.
Behind the scenes. Nothing runs. Every export is a deterministic rendering of the audit that was already computed, which is why exporting is instant and why two exports of the same audit are always identical.
The report is read-only by design. There is no control to edit a finding, override a score, or reword a recommendation. If a finding is wrong, the lever is to re-run the audit, because an audit you can quietly edit is not evidence.
What Good Looks Like
A sound audit reads as though someone who knows HubSpot spent a day in the portal. The findings cite specific numbers from the client's own data. The executive summary says something a partner could not have guessed without looking. The roadmap's P0 items are genuinely urgent rather than merely easy.
Three failure signatures are worth knowing.
An area scores 0%. This usually means the hub is unused rather than broken, and the report will say so in the summary. Check whether the client actually owns that hub before you present a zero as a crisis.
Findings are generic. If a finding could have been written about any portal, the extraction probably returned little for that area, most often because the private app token lacked the scope. Re-issue the token with the missing read scopes and re-run.
The score and the tally look contradictory. They are not. Re-read "The Two Numbers, and Why They Disagree" above; a low weighted score against a decent raw tally is telling you the failures are concentrated in the areas that matter.
One habit worth keeping: the token you were given is a credential to someone else's business. It is used for the session and never saved, but the report it produces contains a detailed map of that portal's weaknesses. Treat the export accordingly.
Who Uses It
Anyone on your team who can sign in to the tools and has a read-only token for the portal being audited. Administrators set the benchmarks and prompts behind the audit in Tools Settings.
Related
- Audit Remediation: price the fixes for the findings.
- Tools Overview: how the tools fit together.
- Tools Settings: the benchmarks the audit scores against.