Website Audit
Point the tool at a live website and it produces a client-ready technical audit: a real browser loads the pages, deterministic checks grade them across six areas, and a model writes up what the failures mean and what to do about them. The result is a scored report you read on screen and download as Markdown (or as a branded PDF when Branded Output is on), covering performance, accessibility, technical hygiene, security, conversion and UX, and how the site reads to AI crawlers.
What It's For
Run a website audit when you need to know the state of a site that already exists: a prospect's homepage before a pitch, a new client's inherited site, or the evidence behind a redesign proposal. It crawls a real URL and grades it.
Do not confuse it with the Website Build Wizard, which is the other website tool on this surface. That one prices building a new HubSpot CMS site; this one diagnoses a site that is already live. They share no data, and you reach for them at opposite ends of an engagement: audit to decide whether work is needed, build to quote the work.
How It Works
The audit is a pipeline, and the single most important thing to understand is that the evidence and the scoring are settled before any model runs.
A real browser loads each page, the same way a visitor's browser would. While the page is rendered the tool collects hard evidence: the HTTP response headers, the rendered page, an accessibility scan, the site's DNS records, a Google performance test, and a set of probes that fetch the page as different crawlers. None of that is a model's opinion; it is what the site actually returned.
Ordinary code then turns that evidence into pass, fail, or not-measured verdicts, each with a fixed threshold, across the six areas. Largest Contentful Paint under Google's bound. No blocking accessibility violations. Security headers present. A single H1. A check either passes or it does not, and no model is consulted.
Only once the verdicts and the scores are fixed does a model see anything. It receives the pass/fail results, the raw evidence, and a scoring rubric, and it writes the analysis: what each failure means for the business, the patterns that cut across areas, and the roadmap. It is explicitly forbidden from changing a verdict, inventing a threshold, or claiming legal or compliance status. So the scores are arithmetic you could reproduce by hand; the judgment about what they mean is the model's, grounded in evidence it was not allowed to invent.
The Score, and Why the Colour Can Be Worse Than the Number
The report leads with an overall score as a percentage, in a colour. Both are computed, and they can seem to disagree.
The overall percentage is a weighted average of the six area scores, not a plain pass rate, because the areas do not matter equally. Conversion and UX, performance, and accessibility carry the most weight. Technical hygiene and security carry a little less. How the site reads to AI crawlers carries the least.
A red area holds the colour at orange. If any scored area is red, the overall colour is held at orange even when the average would be green. The number is left exactly as the arithmetic produced it. So a site can read a respectable percentage in an orange headline: one red area holds the colour back even when the average is healthy, because an average that hides a serious failure is arithmetically honest and rhetorically misleading.
What "Not Measured" Means
A check the tool could not evaluate is recorded as not measured, and that is a real, third state that is deliberately kept apart from failing. If the performance test did not answer, or the accessibility scan could not run, or DNS did not resolve, the dependent checks come back not-measured rather than being scored as passes or failures.
Not-measured checks are excluded from the score entirely: they count in neither the numerator nor the denominator. An area with nothing measurable reads "n/a" and in grey, and contributes no weight to the overall. The report states the not-measured count next to the score for exactly this reason, so a number built on thin evidence never poses as a confident verdict.
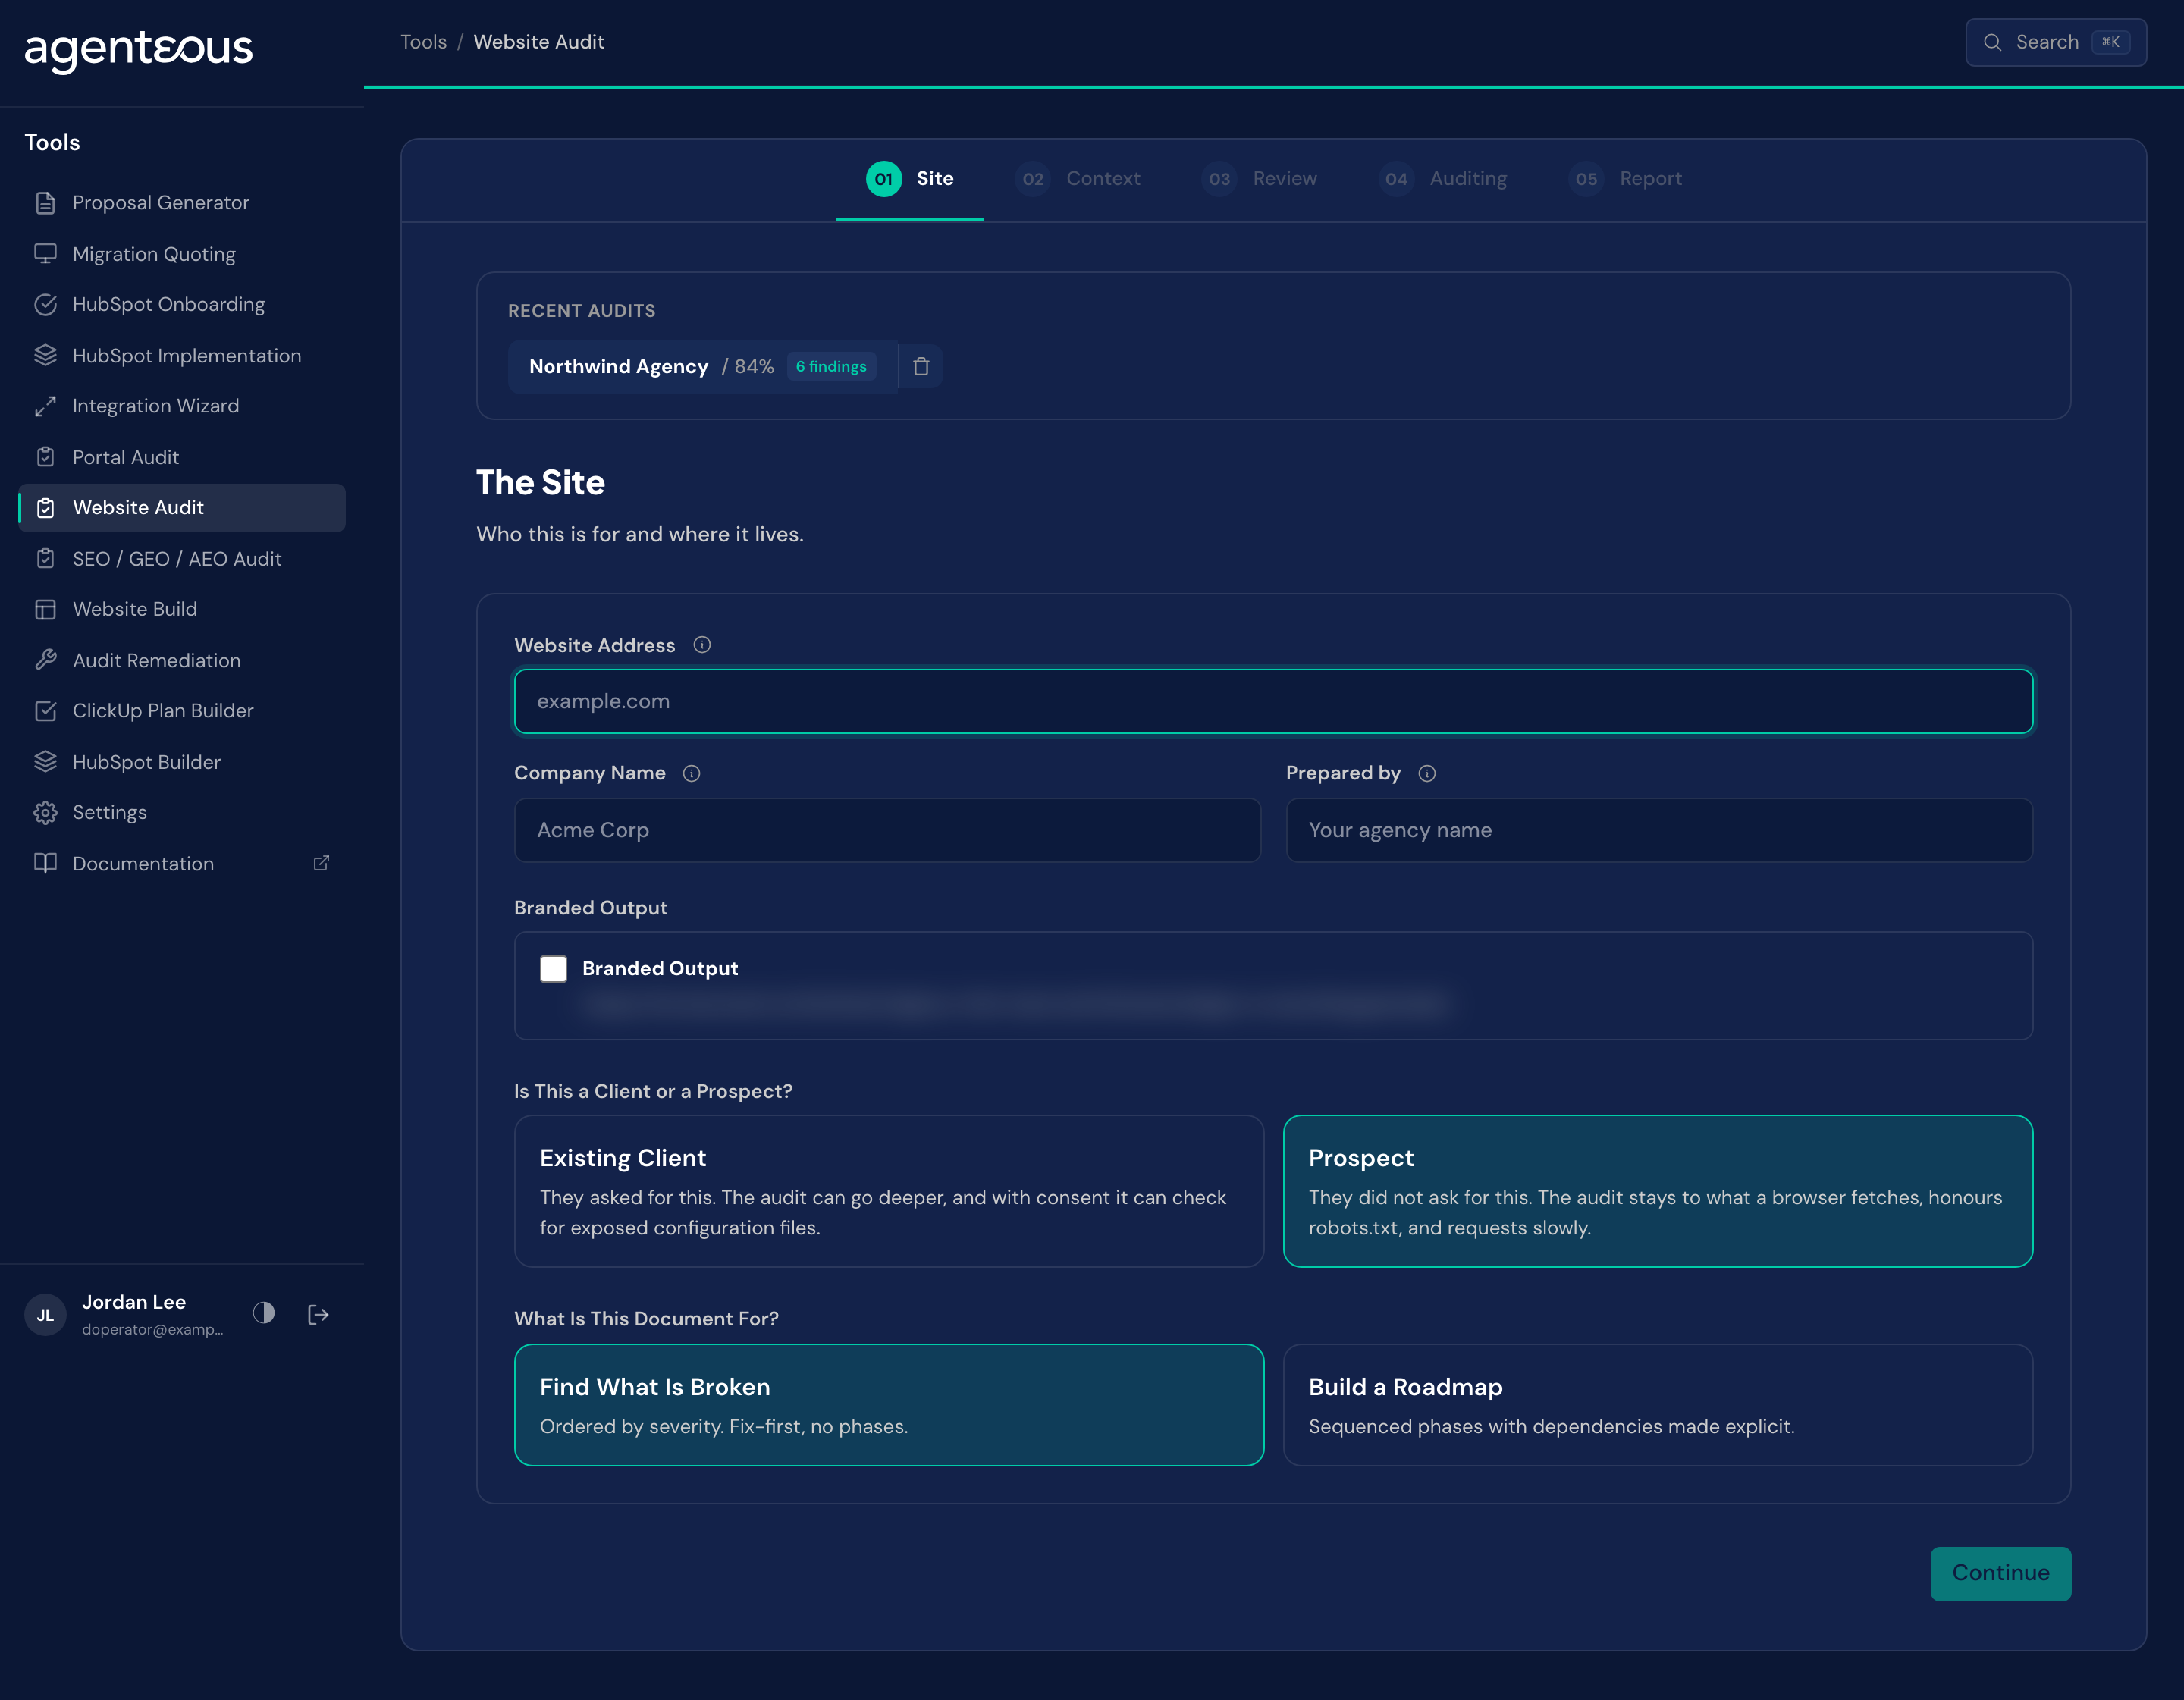
Site
What you supply. The website address, which is the homepage; you add specific pages on the next step. Optionally the company name and your agency's name (labelled Prepared by), which appear on the report. A Branded Output switch adds an agency-branded PDF to the downloads. Then two choices that shape everything downstream.
Audience: client or prospect. This is a consent boundary, not a label. For an existing client who asked for the audit, the tool may go deeper, and with explicit consent it may check for exposed configuration files. For a prospect who did not ask, the audit stays to what a browser fetches, honours the site's robots.txt, and requests gently. Switching the audience away from client automatically revokes any consent you had recorded.
Goal: triage or roadmap. Triage orders the output by severity, fix-first, with no phases. Roadmap sequences the work into phases with dependencies made explicit. This changes how the document is written and ordered; it never changes the findings.
Behind the scenes. No model runs here.
Context
What you supply. Optionally who the site is for, what it is meant to do, and what the client measures. Plus up to five additional pages to audit beyond the homepage.
What happens. This context is optional and it changes only emphasis. The findings are the same either way; what a finding is said to cost the business is where the context earns its place. Leave it blank and the audit still runs.
Review
What you supply. A confirmation, and for a client, consent. The screen restates the target, the audience, the deliverable, and the page count.
The consent tier. For a client audience, a checkbox lets you attest that the client authorized security checks and that you can name who authorized it. Only then does the audit probe for exposed configuration and version-control files, and it records the request as a path and a status code, never the contents. For a prospect, the checkbox is not shown at all: consent cannot be recorded for a prospect at all. If a live credential is ever found, it never appears in the document; it goes to a named person at the client, out of band.
Behind the scenes. No model runs here either.
Auditing
What you supply. Nothing. This is a progress display, and it takes a couple of minutes because a real browser is loading real pages.
What happens. Five phases run in order, and the screen names each as it goes. The site is rendered and its evidence collected. The checks are run, which is instant because it is pure computation. Each area is analysed. The report is written. The prose is edited. Only the last three phases involve a model.
If the connection drops. If the audit is interrupted, the evidence already collected is kept, so running the audit again resumes from where it stopped rather than crawling the site a second time.
Report
What you get. A score header with the overall percentage in its area colour, the checks-passed tally, and the not-measured count on the same line. Below it, a card per area. Then four tabs. Overview carries the executive summary and the cross-cutting themes, each with a risk level, and a fixed note on the method and its limits. Findings lists everything found, sorted by severity, each with its impact, a fix, and an effort estimate, and a quick-win badge where it earns one. All Checks shows every individual check and whether it passed, failed, or could not be measured, with the reasoning. Roadmap is the prioritized plan, P0 through P4.
What you can do. Download the audit as a Markdown document, once it has saved, or as a branded PDF when Branded Output was on at Setup. The Markdown is rebuilt from the saved audit, so two downloads of the same audit are identical, and it forks on your goal: a triage document leads with what to fix first, a roadmap document with a phased plan. Saved audits are listed under Recent Audits on the first screen, and opening one goes straight to its report.
Behind the scenes. Nothing new runs on this step. The report is a rendering of the audit that was already computed.
What Good Looks Like
A sound audit reads as though someone who knows the web spent an afternoon in the site. The findings point at specific evidence the crawl actually gathered. The executive summary says something a partner could not have guessed from the homepage. The roadmap's P0 items are genuinely urgent rather than merely easy.
Three failure signatures are worth knowing.
A whole area reads "n/a" in grey. Nothing in it could be measured. Most often the accessibility scan or the performance test did not run, or DNS did not resolve. Re-run before you present a grey area as a finding; not-measured is not a failure.
The score is healthy but the headline is orange. That is the red-area rule doing its job. One area scored red, and the report is refusing to let a good average paint over it. Read the section cards to find which one.
Findings feel generic. If a finding could have been written about any site, the crawl probably returned little for that area, usually because a page did not render or a probe was blocked. Confirm the pages loaded and re-run.
One habit worth keeping: on a client audit with consent, the report contains a map of that site's weaknesses, including anything the security probes surfaced. It is used for the audit and the sensitive parts never enter the document, but the document you do get is still a candid account of someone else's site. Treat the export accordingly.
Who Uses It
Anyone on your team who can sign in to the tools, usually whoever prepares site reviews for clients and prospects.
Related
- SEO / GEO / AEO Audit: grade search and AI visibility instead.
- Website Build: price a rebuild once the audit is done.
- Tools Overview: how the tools fit together.